Custom Indicators in Backtesting.py

Indicators are the fundamental building blocks of any strategy. They can represent any kind of information and give you a metric with which to base your strategies upon. If you're completely new to backtesting.py I'd recommend reading our quickstart guide first.
Signals Strategy
The first "indicator" that I'm going to implement here is a signals-based strategy. This is really useful if you already have an indicator that you've built outside of backtesting.py, and want to quickly run a backtest without having to transfer all the logic into the framework.
In my case I'm going to generate some random buy/sell signals with np.random.randint, then write some simple buy/sell logic to trade based on that.
1from backtesting import Backtest, Strategy
2from backtesting.test import GOOG
3import numpy as np
4
5GOOG["Signal"] = np.random.randint(-1,2,len(GOOG))
6
7print(GOOG)
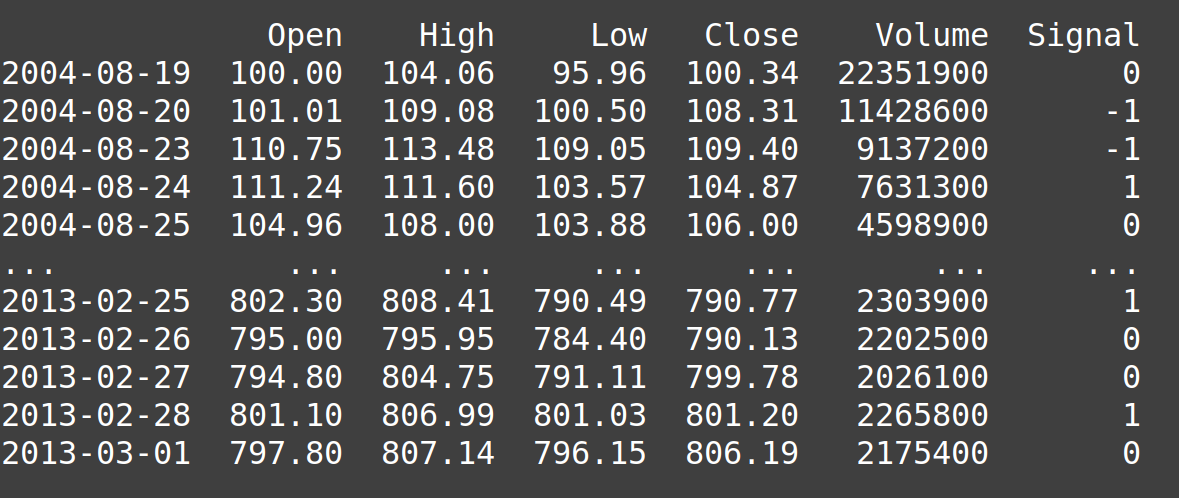
We use some built-in GOOG test data here, which should print something like:

Signal value of 1 to mean buy, -1 is sell, and 0 is do nothing. Next we need a bit of Backtesting.py boilerplate.
 1...
 2class SignalStrategy(Strategy):
 3
 4    def init(self):
 5        pass
 6
 7    def next(self):
 8        pass
 9
10bt = Backtest(GOOG, SignalStrategy, cash=10_000)
11
12stats = bt.run()
13print(stats)
14bt.plot()
This will of course produce no trades. The magic here of backtesting.py is that we can now pull the data from the Signal column into our next function, much like we have before for close price data
1...
2    def next(self):
3        current_signal = self.data.Signal[-1]
4...
If you print that out you'll find that it prints the signal value for that bar on every loop. If we add in some simple buy/sell logic, our backtest is complete:
 1...
 2    def next(self):
 3        current_signal = self.data.Signal[-1]
 4        if current_signal == 1:
 5            if not self.position:
 6                self.buy()
 7        elif current_signal == -1:
 8            if self.position:
 9                self.position.close()
10...
If your strategy demands it, you can of course get creative with the buy/sell logic, introducing stop-loss, take-profit, etc.
This is a great first step into the framework if you haven't used it before, but we're missing out on a lot of stuff like parameter optimisation etc. by running our backtests like this. In our next strategy, we'll take a close look at the indicator function in backtesting.py.
Bollinger Bands with Pandas-ta
In this section I'll show you how to integrate an external library like pandas-ta to produce your own wrapped-indicator in backtesting.py. You of course don't have to use a TA library. As long as the end result is an ndarray you can use whatever python sorcery you can think of here.
In Backtesting.py we have the I function which allows us to define indicators within the framework. It can wrap-around any arbitrary python function that returns an ndarray and drip-feed that data into our next function, removing a lot of potential look-ahead bias. Here's an example at how that might look for us.
 1...
 2def indicator(data):
 3    bbands = ta.bbands(close = data.Close.s, std = 1)
 4    return bbands.to_numpy().T[0:3]
 5
 6class DFStrategy(Strategy):
 7
 8    def init(self):
 9        self.bbands = self.I(indicator, self.data)
10...
I'm defining a function here called indicator, that takes in data, runs that through ta.bbands, converts the resulting DataFrame to a numpy array, transposes it and returns only the first 4 rows.
Note I used data.Close.s here to get the closing price data as a pandas series rather than as an ndarray.
We can then use that function to define our indicator in init. Recall that in general we want to do all pre-computation in the init function rather than in next. Since we have all the data present before the backtest begins.
Since ta.bbands returns a dataframe rather than a simple series, we should pay special attention to the output. When you're retrieving the data in next, each row in self.bbands actually represents a column in the original returned dataframe. This occurs regardless or not you transpose the data when returning it. Therefore our next function could look something like this:
 1...
 2  def next(self):
 3
 4        lower_band = self.bbands[0]
 5        upper_band = self.bbands[2]
 6
 7        if self.position:
 8            if self.data.Close[-1] > upper_band[-1]:
 9                self.position.close()
10        else:
11            print(self.data.Close[-1], lower_band[-1])
12            if self.data.Close[-1] < lower_band[-1]:
13                self.buy()
14...
We simply buy when the closing price is above the upper band, and sell when it goes below. Remember to update the class name in Backtest!
Momentum Strategy
To give you another example of how to write a simple indicator which can be easily turned into a strategy, let's write up a momentum strategy. We buy when the asset is increasing in price over a 7 day period, and sell when it stops increasing.
We start off by defining a new indicator function:
1def indicator(data):
2    # Data is going to be our OHLCV
3    return data.Close.s.pct_change(periods = 7) * 100
We're just using raw pandas here, no fancy libraries. Then simply update our Strategy class and we're good to go
 1...
 2    def init(self):
 3        self.pct_change = self.I(indicator, self.data)
 4
 5    def next(self):
 6
 7        change = self.pct_change[-1]
 8
 9        if self.position:
10            if change < 0:
11                self.position.close()
12        else:
13            if change > 5 and self.pct_change[-2] > 5:
14                self.buy()
15...
If you go back over and study the three examples we've done so far, along with our quickstart guide, you should be in a position to create any indicator you can think of. If you'd like help implementing a specific idea, you can get in contact with me using the contact link in the navigation bar at the top.
Video tutorial
If you'd prefer a video tutorial, you can check out the video I posted on my channel here: